Ratio Analysis
|
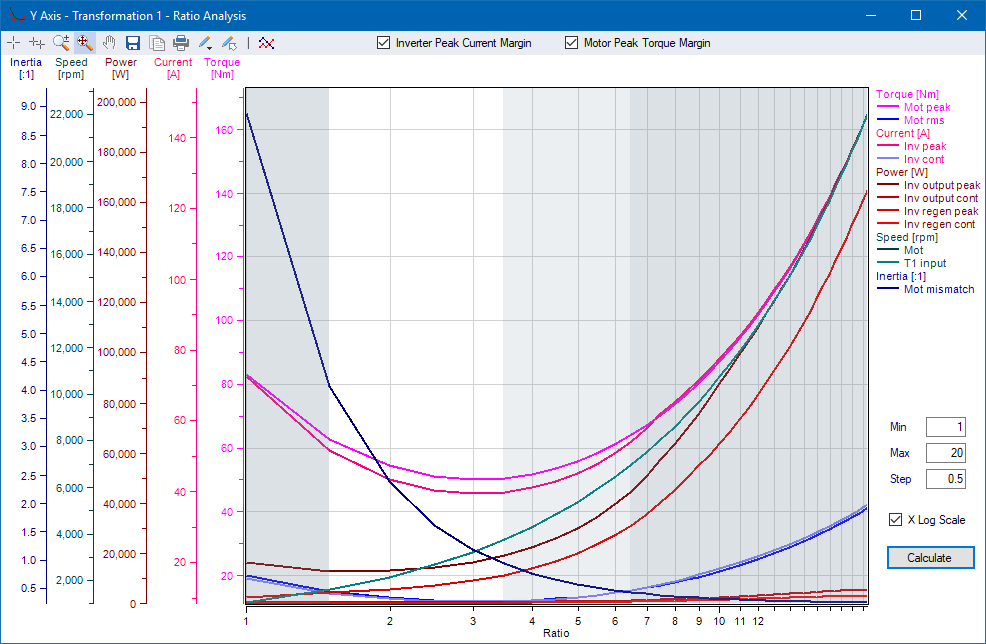
Apply a Ratio Analysis for any Transformation stage. Specify the Min and Max ratios and the step, which defines the sample resolution. Click ‘Calculate’ to perform the analysis.
The chart below illustrates how the torque, current, power and inertia mismatch requirements change as the gearbox ratio increases from 1 to 20.
| Note: Only the ratio changes; all other variables are held constant. |
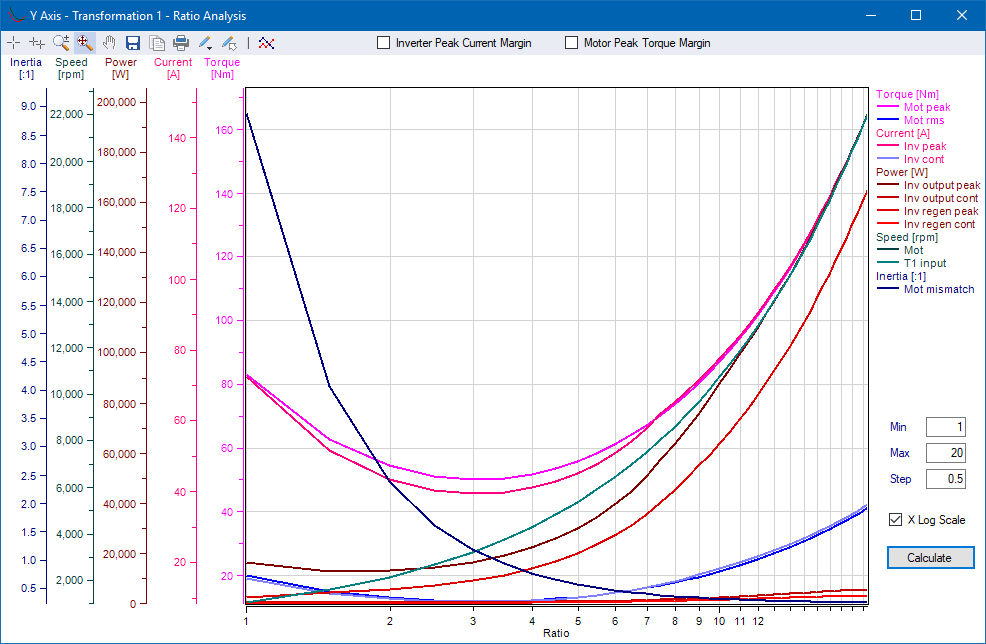
Enable either one or both of the 'Inverter Peak Current Margin' and 'Motor Peak Torque Margin', and shaded areas will appear showing which ratios exceeded those limits. Therefore, what remains unshaded are the ratios that operate within the drive inverter peak current margin and the motor peak torque margin. In the example below, those valid ratios are 1.5 to 3.5.