Energy Cost and Power
Flow
|
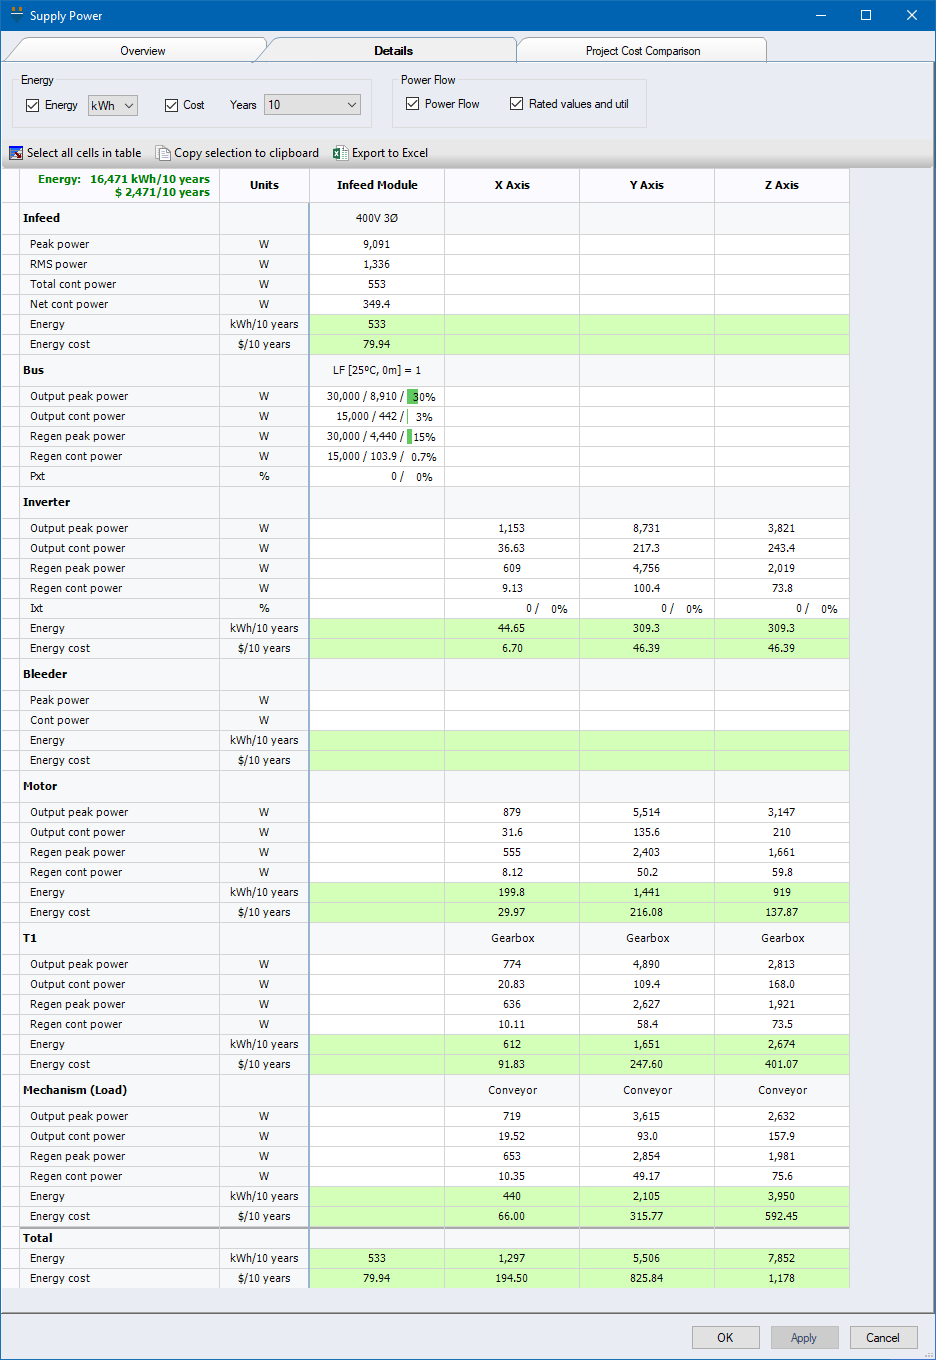
The table below shows the energy cost and power flow through each component in the power group. Where rated power values apply, 3 values are displayed as "Rated / Required / Utilization".
For example, see the Infeed Bus power shown in the table below.
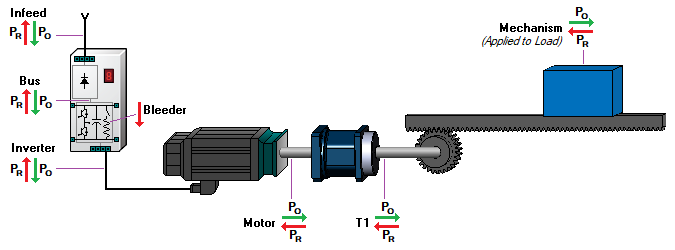
The diagram below illustrates the specific location for each component's power flow - Output Power (Po) and Regen Power (Pr). Note that the Mechanism power is the power applied to the Load. This is also refered to as the "Load Power". The equivalent for a servo pump is the Hydraulic Power (QxP).