News
Company News
SERVOsoft® News
- SEW EURODRIVE publishes product data for new PxG® economy line
Jun 16, 2026 - SERVOsoft v4.7.110 Released!
May 17, 2026 - SERVOsoft v4.7 Released!
Feb 16, 2026 - WITTENSTEIN cyber motor
publishes servo drive
solutions in SERVOsoft
Sep 29, 2025 - SERVOsoft Cloud Released!
May 23, 2025 - Energy Storage Modules
Tutorial
Jan 12, 2025
XY Chart News
ControlEng Releases XY Chart NET v3
Nov. 21, 2012
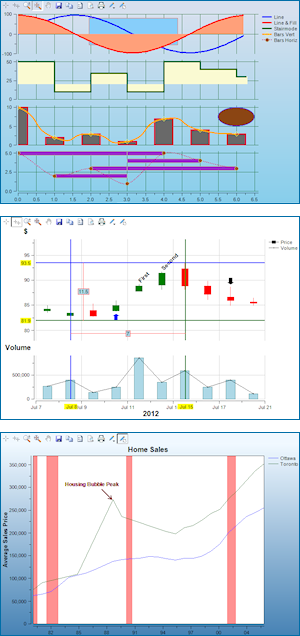
XY Chart NET v3 is now 50% faster for large data sets when compared to v1.4. New features include time series and financial charting, delta crosshairs, annotations, and improved language localization, along with many more enhancements listed below.
XY Chart NET is a .NET WinForms control that integrates seamlessly into your Visual Studio .NET applications, reducing your time to market, while providing powerful line, bar and scatter charts for presentation and analysis. Very little programming is required thanks to XY Chart NET's key built-in features such as zoom, scrollbars, pan, annotations, crosshairs, delta crosshairs and coordinates display.
Enhancements
- Fully supports Visual Studio 2008/10/12
- Up to 50% performance improvement for large data plotting when compared to v1.4.
- Added Time Series and Financial charting including recession and candle stick profiles
- Added Annotations, that can be created and edited programmatically and directly from the chart toolbar
- Added Delta Crosshairs where the difference between two X values and/or Y values are displayed
- Enhanced toolbar customization including support for adding custom buttons in the built-in toolbar
- Added adjustable YStack gap height, to adjust the gap between YStacks
- Added AutoScaleRangeFactor, which determines the margin to apply to the scale range when using Auto Scale mode. Value cannot be less than 0. Default = 0.05, which was the embedded value in v1.x.
- Added DisplayPerYStack, which allows multiple legends, each displayed with profiles beside their corresponding YStack
- Added Gradient support for profile Markers/Bar/Fill/Candle/Recession and Shape Annotations
- Added new Language property, which allows the use of included translations in the language xml file
- Support for the zoom window starting outside the plot area